RQ1
Map the optimization methods used for corrugated board and their economic and environmental contribution.
Design & optimization
Explore the recorded optimization results one case at a time. Compare the final summary with its iteration history, or watch the optimization sequence.
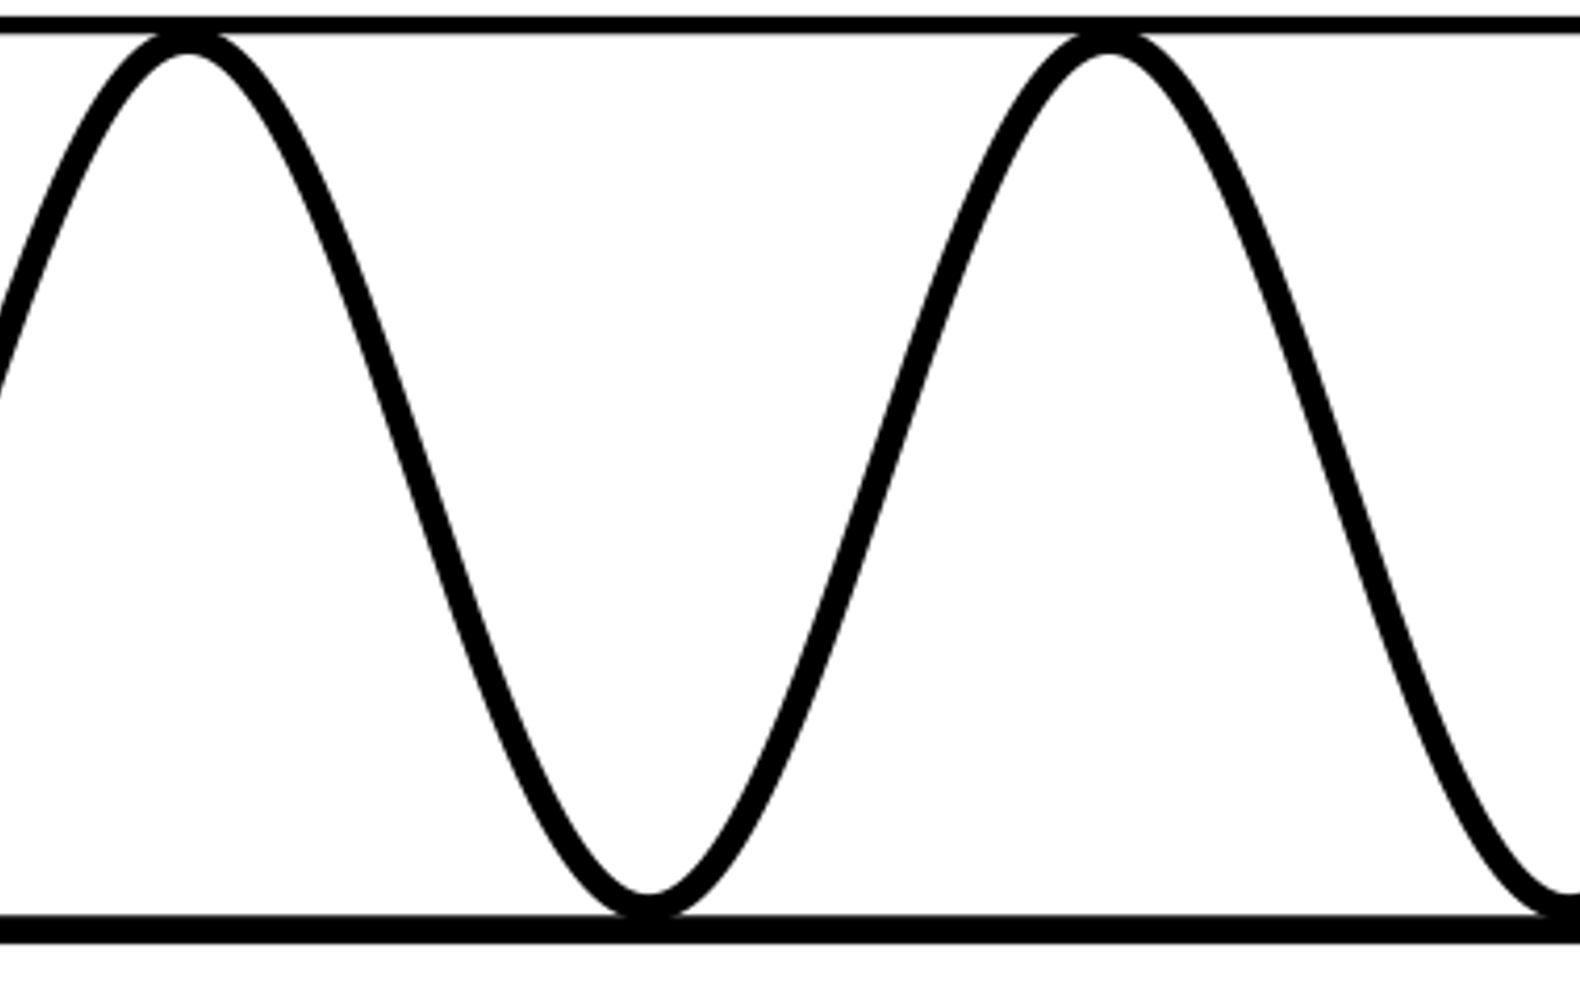
Explore the recorded outputs
33 cases · 200 frames in this case
Evidence boundary
The result images and videos come from the public MIT-licensed output repository. The related geometry and calculation repository is public under a view-and-cite-only licence, so its code is deliberately not embedded or adapted here. The published assets do not include a solver version, boundary conditions, physical-time calibration, mesh or field data.
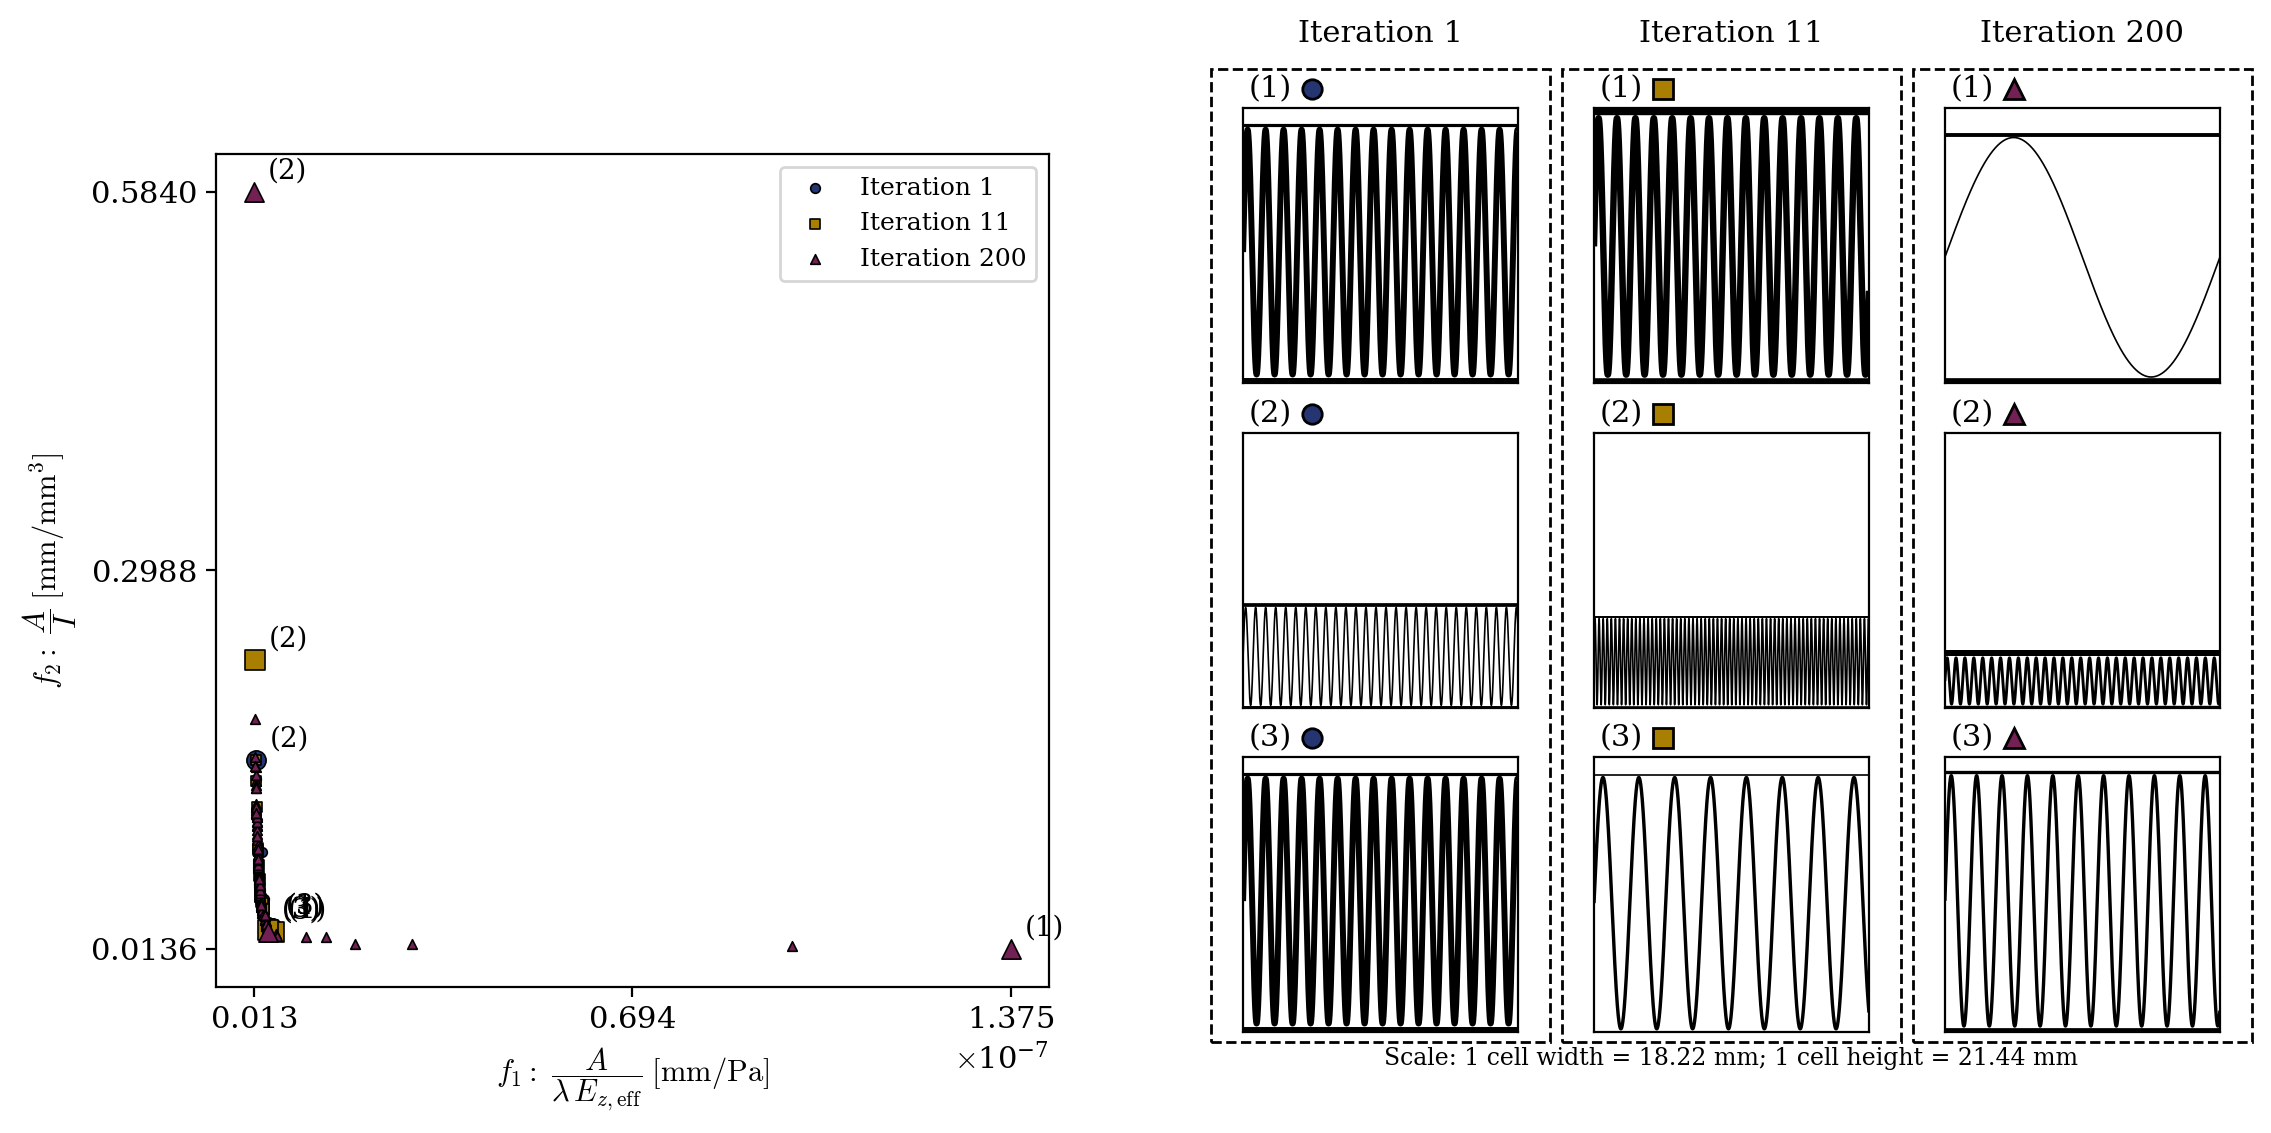 Loading Part A C001, published result summary
Use the original matrix to identify the design variables and constraints for each case.
Liner/flute thickness ranges, control points, curvature constraints and optimizer settings are defined in the matrix. Part B uses the separately published dimensionless study outputs.
Paper evidence audit
This panel transcribes the published design domain, response definitions and evaluation budget. It is source evidence, not a replay: the recorded optimization images above are not a Gaussian-process acquisition trace.
| Variable | Symbol | Minimum | Maximum |
|---|---|---|---|
| Flute thickness | t | 0.005 m | 0.02 m |
| Flute amplitude | a | 0.001 m | 0.01 m |
| Flute wavelength | λ | 0.0001 m | 0.002 m |
| E₁ | 1,709,000,000 Pa |
|---|---|
| E₂ | 918,000,000 Pa |
| E₃ | 8,995,000 Pa |
| G₁₂ | 485,000,000 Pa |
| ν₁₂ | 0.4 — |
| G₁₃ | 31,070,000 Pa |
| G₂₃ | 26,230,000 Pa |
| ν₁₃ | 0.001 — |
| ν₂₃ | 0.001 — |
Review evidence map
The 2023 review organizes corrugated-board optimization across history, manufacturing, structural design, objectives and algorithms. This map connects those review lenses to evidence already exposed in ProjectHub; it is not a solver, dataset or reproduced paper result.
RQ1
Map the optimization methods used for corrugated board and their economic and environmental contribution.
RQ2
Trace how those methods evolved and identify the drivers behind the change.
RQ3
Identify state-of-the-art limitations that point to future optimization trends.
| Project evidence | Class | Boundary |
|---|---|---|
| 72-case recorded explorer → | Recorded optimizer outputs | The source frames are not a dataset extracted from the review and do not prove coverage of every method it surveys. |
| Gaussian-process paper audit → | Single-paper parameter and budget audit | The audit is not an EHVI replay and the recorded frames are not a Gaussian-process trace. |
| Corrugated-board FEM → | Executed reduced model plus source-bounded FEM audits | Reduced calculation, paper evidence and solver outputs remain separate evidence classes. |