Back to ProjectHub

Experimental data & graphs

Graph-based Corrugated Board Compression

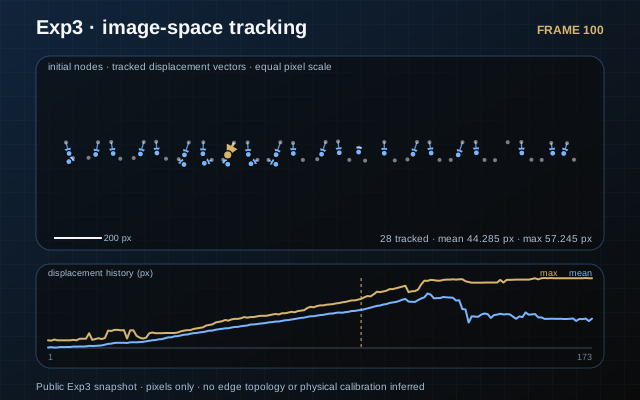
Inspect how publicly archived graph nodes move through a corrugated-board compression sequence. The interactive view stays in image pixels and preserves missing observations instead of converting, smoothing or reconstructing unavailable source data.

Inspect exact public node coordinates and pixel displacement histories from a corrugated-board compression analysis.
Snapshot: public Exp3, skeletonization, frame-subsampling setting 10.

Archived specimen images

Specimen frames

View

Loading frame…

Probe1_22 · Original frame · Frame 01024 × 256 px

Open the prediction demonstration in a full window

Open the training comparison in a full window

Exp3 · Tracked node displacement data

Exact public CSV snapshot

Tracked-node displacement inspector

Loading the archived displacement inspector…

Article evidence audit

Two filmed compression experiments

The CC BY 4.0 article records experimental compression videos converted into image-derived graphs. The paper cases are kept separate from the exact public Exp3 snapshot above and from the independent truss benchmark below.

Specimen
C-flute · 100 × 25 mm
Board geometry
H 4.0 ± 0.1 mm · λ 8.0 ± 0.2 mm · papers 250 ± 80 µm
Image calibration
256 × 1024 px · 87 ± 2 µm/px
Test conditions
5 mm/min · 23 ± 1 °C · 50 ± 2% RH

Experiment 1

44 tracked nodes

22 upper + 22 lower nodes · clustering inspected at frame 127

Vertical and horizontal displacement clustering formed four periodic node subgroups. Three of four load peaks were predicted from group motion; peaks A and B appeared less than 100 µm of deformation before the measured peaks.

Reported buckling rule: Start at the first flute-segment angle sign change; end at 90% of segments.

Experiment 2

40 tracked nodes

20 upper + 20 lower nodes · clustering inspected at frame 133

The same four subgroup construction was recovered, while the horizontal motion direction and sequence differed from Experiment 1. The buckling range surrounded the highest measured peak.

Reported buckling rule: Start at the first flute-segment angle sign change; end at 80% of segments.

Image-to-graph pipeline

  1. Gaussian blur (5 × 5, σ = 1)
  2. Constant-threshold binarization (25)
  3. Connected-component filtering (minimum 150 px)
  4. Median blur (3 × 3)
  5. Skeletonization and graph construction
  6. Graph filtering, node tracking and displacement clustering

Limits preserved

  • Only two selected specimens are analysed in the article.
  • Image quality and lighting materially affect the graph extraction.
  • Filtering inputs are manually adapted for each sample.
  • The node-tracking policies need broader outlier validation.

The interactive tracker on this page is an exact public Exp3 pixel-coordinate snapshot from the repository, not either article experiment replay. It contains no video, graph edges, force curve or physical calibration. The separate truss lab is an independent reduced benchmark, not an article result or FEM simulation.

Executed independent benchmark

Reduced direction-dependent axial truss

Loading the deterministic browser calculation…

Paper link and evidence boundary

Graph-truss compression study

The CC BY 4.0 TechRxiv v1, posted 3 August 2025 preprint uses frame-specific image-derived graphs, direction-dependent members and quasi-static loading to report axial force, shear, bending moment and deformation for four selected compression states. Its public source records EMD = 2.5 GPa, EZD = EMD/200, board width 25 mm and sample length 100 mm.

C1 · Experiment 1 Peak A

335 N · 134 kPa · frame 48

C2 · Experiment 1 Peak D

619 N · 245 kPa · frame 121

C3 · Experiment 2 Peak A

516 N · 206 kPa · frame 55

C4 · Experiment 2 Peak C

711 N · 284 kPa · frame 129

These four values are cited paper evidence, not outputs of the reduced benchmark above. ProjectHub still lacks a permission-cleared frame topology/member-property/load archive needed to reproduce the paper solver. The current public Graph-CB files remain experimental pixel tracking and are not relabelled as simulation.
CC BY 4.0 preprint · TechRxiv v1

Mapping, units and limits

The public pipeline exports frame-0 coordinates as row_px and col_px. It records dx_px = new_col − first_pre_col, dy_px = new_row − first_pre_row and their Euclidean magnitude for each node/frame observation.

  • Snapshot: public Exp3, skeletonization, frame-subsampling setting 10.
  • 46 initial coordinates, 36 tracked node IDs and 3,626 displacement observations across frame indices 1–173.
  • All spatial values are image pixels. No public calibration supports conversion to millimetres.
  • The current public tree contains no sample video, edge table or serialized per-frame graphs, so this page does not reconstruct edges or claim synchronized imagery.
  • This is archived experimental image-analysis output, not a finite-element simulation.